Economic Update - February, 2019
posted on Thu, Feb 21, 2019
I am from the mindset that we should invest having a long-term and goal oriented approach. Daily news reports should not dictate how our money is invested. With
that in mind we should always have an eye on what the economy is doing on a macro level. Since 1955, the U.S. has experienced nine recessions. My goal with this
report is to help identify the next recession so that we can make adjustments to your investment strategy accordingly.
Analyzing the economy is far from an exact science and with of all the data now available at our fingertips it is easy to run around in circles without coming to any real conclusions. I have found that by focusing our attention on three macro level reports we can get a general idea of where the U.S. economy is currently and make investment decisions accordingly.
1) Inverted Yield Curve
An inverted yield curve is when the 2 year U.S. treasury rate falls below the 10 year U.S. treasury rate. The last 9 times this happened (since 1955), the U.S. economy entered a recession within the next 16 months (on average).
As of February 21, 2019 the 10 year Treasury rate is 2.69% and the 2 year Treasury rate is 2.53%. That is a positive difference of 0.16%. Over the past year it has been in a range of 0.15 - 0.45. With all that, as of February 21, 2019 we have not entered into an inverted yield curve. However, it is getting close.
2) FRED Smoothed Recession Probability
This is a model which attempts to predict the probability of a recession based on non-farm payroll employment, the index of industrial production, real personal income excluding transfer payments, and real manufacturing and trade sales. Historically, three consecutive months of smoothed probabilities above 80% has been a reliable signal of the start of a new recession, while three consecutive months of smoothed probabilities below 20% has been a reliable signal of the start of a new expansion.
The data for this model is usually a couple months in arrears and as of February 21, 2019 the probability for a recession is 0.80%. That is consistent with last month.
3) Economic PI Baseline
By plotting 19 key economic indicators, the BaR Analysis Grid© clarifies current economic conditions and signals how near the economy is to a recession. The red and green squares are different calculations of the average for all the plotted points. It indicates the overall health of the economy. If one of those squares hits the area shown by a light red rectangle, that would indicate the possible beginning of a recession.
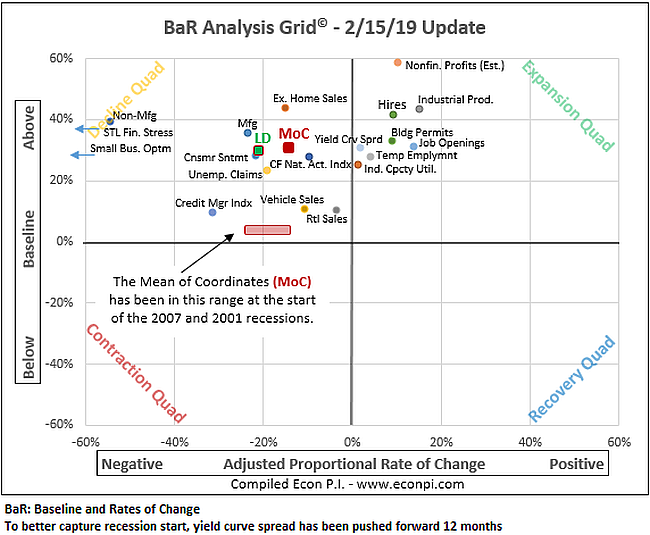
There is a lot of data illustrated on the chart, but as of February 15, 2019 the average has not triggered the start of recession. It has moved significantly over the past three months, but has stabilized in the last 30 days. As a result my equity strategies shifted to a slightly more defensive strategy for 2019 (moving more weight to the health care, utilities and consumer staples asset classes).
Conclusion:
There are 4 major stages to an economic cycle:
1) Early Recession - Consumer expectations are at their worst, industrial production is falling, interest rates are at their highest and the yield curve is flat or even inverted.
2) Full Recession - GDP has been retracting quarter over quarter, interest rates are falling, consumer expectations have bottomed and the yield curve is normal.
3) Early Recovery - Consumer expectations are rising, industrial production is growing, interest rates have bottomed and the yield curve is beginning to get steeper.
4) Late Recovery - Interest rates can be rising rapidly, with a flattening yield curve. Consumer expectations are beginning to decline and industrial production is flat.
Based on the data from this report, as of February 21, 2019 it appears that we are still in the late recovery phase and could be entering the early recession phase in the next couple years.
Please feel free to contact me anytime to discuss in more detail.